Terragraph
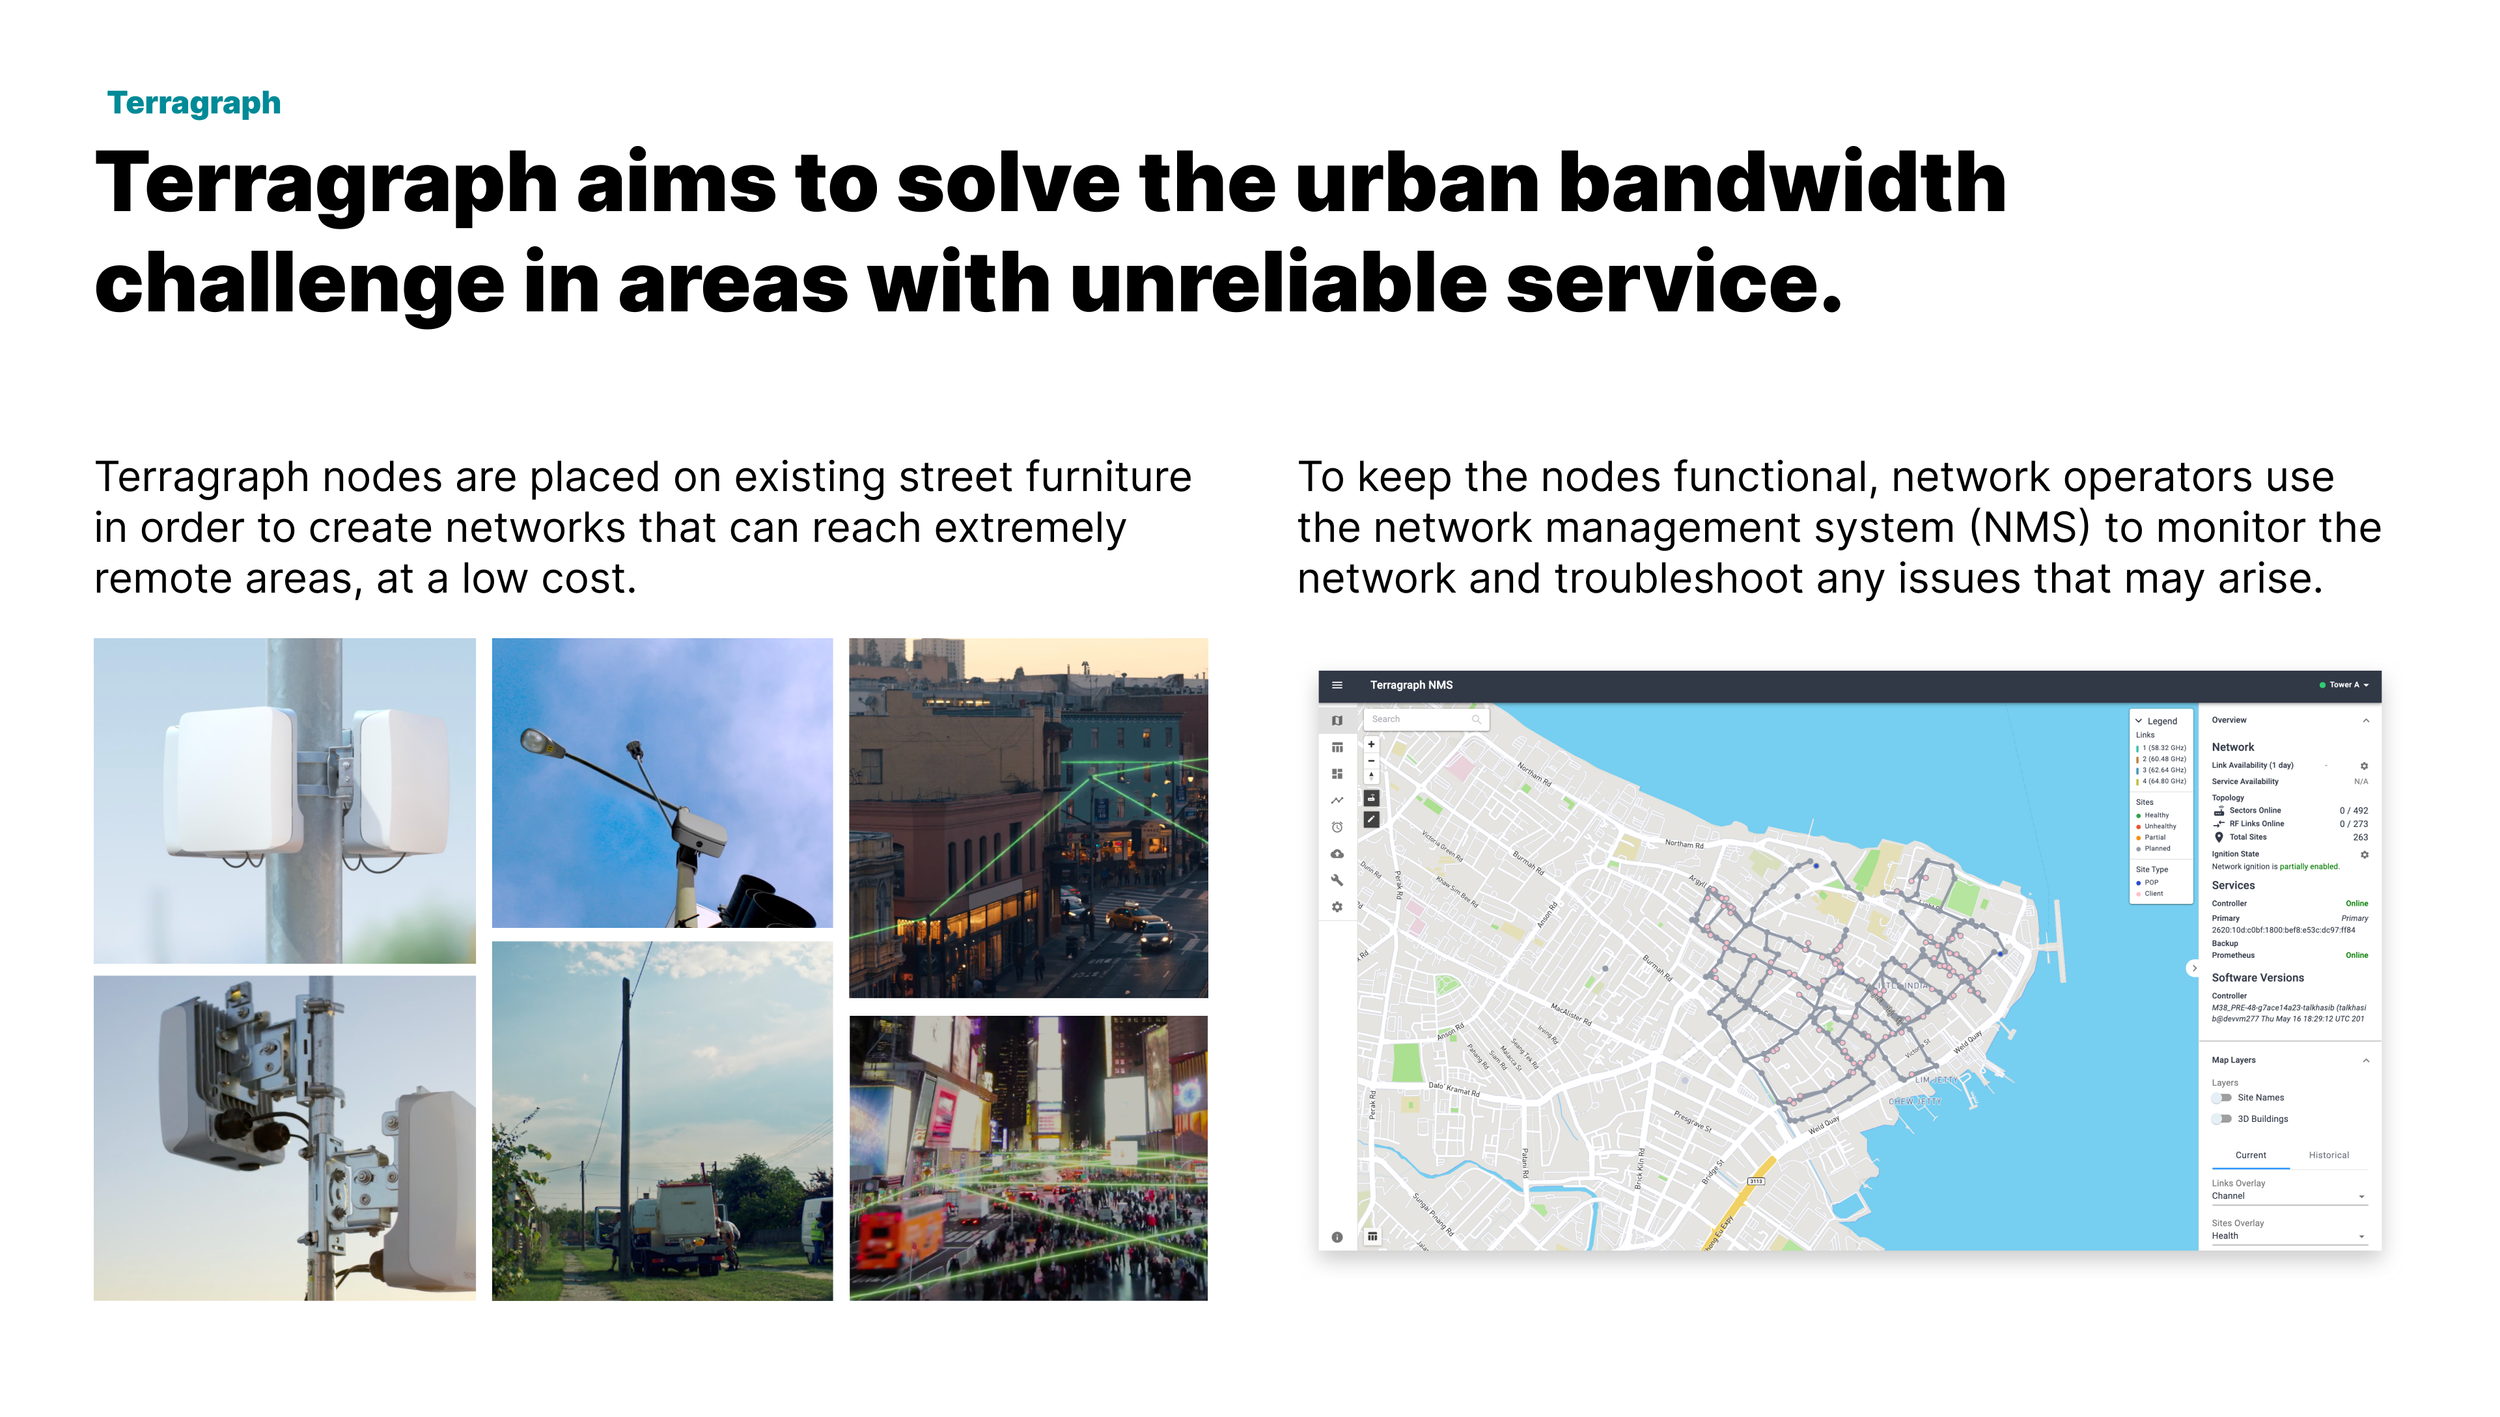
Improving the experience for network operators bringing low cost internet to remote and underserved areas.
Skills UI/UX Design
Team Meta Terragraph Team
Problem Network operators need to keep networks online, constantly triaging issues and maintaining all nodes. The prior UI slowed down their ability to diagnose and remedy issues, resulting in long down-times when things went wrong.
Monitoring Network Performance
Users have no way to see how well a part of the system is performing, they only get to see if it is up or down. They need to be able to see specifics.

Design Strategy
Deliver performance information summarized succinctly, so that they can interpret it quickly and identify problem areas.
Decoding Visual Hierarchy
Terragraph map visualization over used color to convey relationships. Color is being used as both a categorical symbol (equipment type) and a qualitative indicator (health) on the same map object: The site pins.
The color system requires a lot of mental energy from the user, requiring memorization which slows scanning time.

Design Strategy
Introduce iconography to distinguish equipment type, leave color for state.
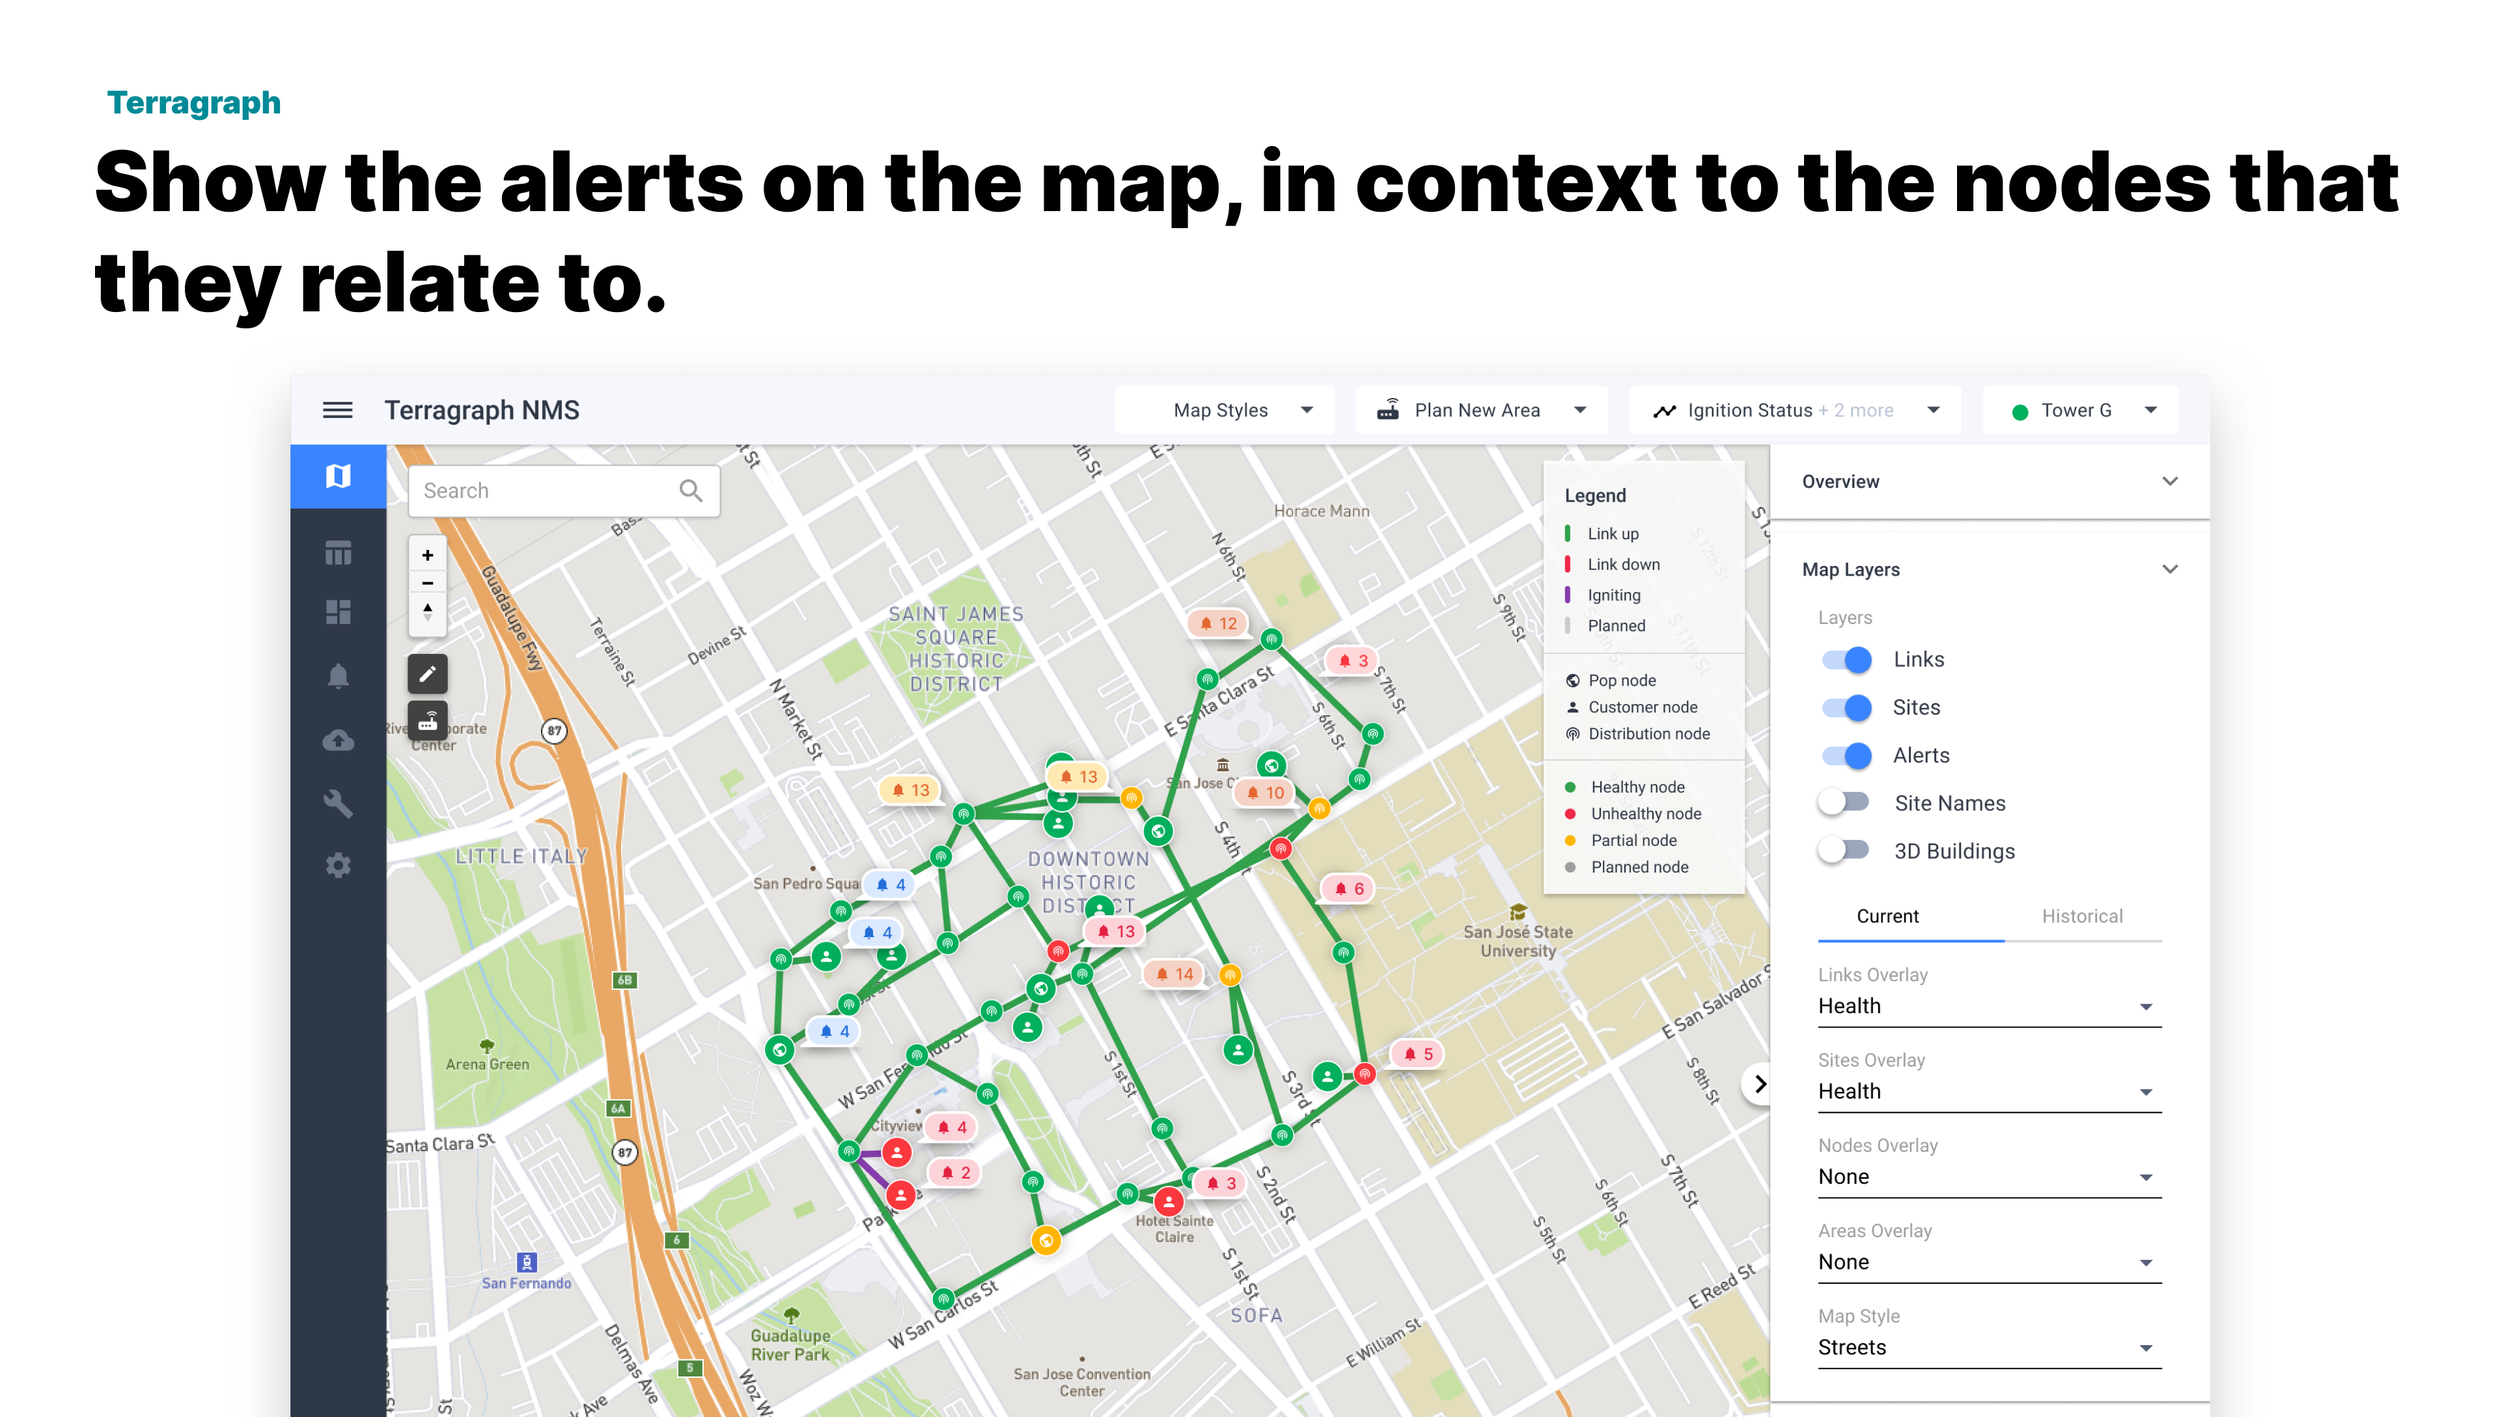
Prioritization Systems
In order for a user to accurately monitor their system, they need to be able to prioritize what areas to look at. Currently the user is lacking a way to quickly scan multiple links/nodes before deciding on one to investigate.

Design Strategy
Allow the user would need to see places on the map that are on high alert.